
Streaming prices vs inflation since 2019
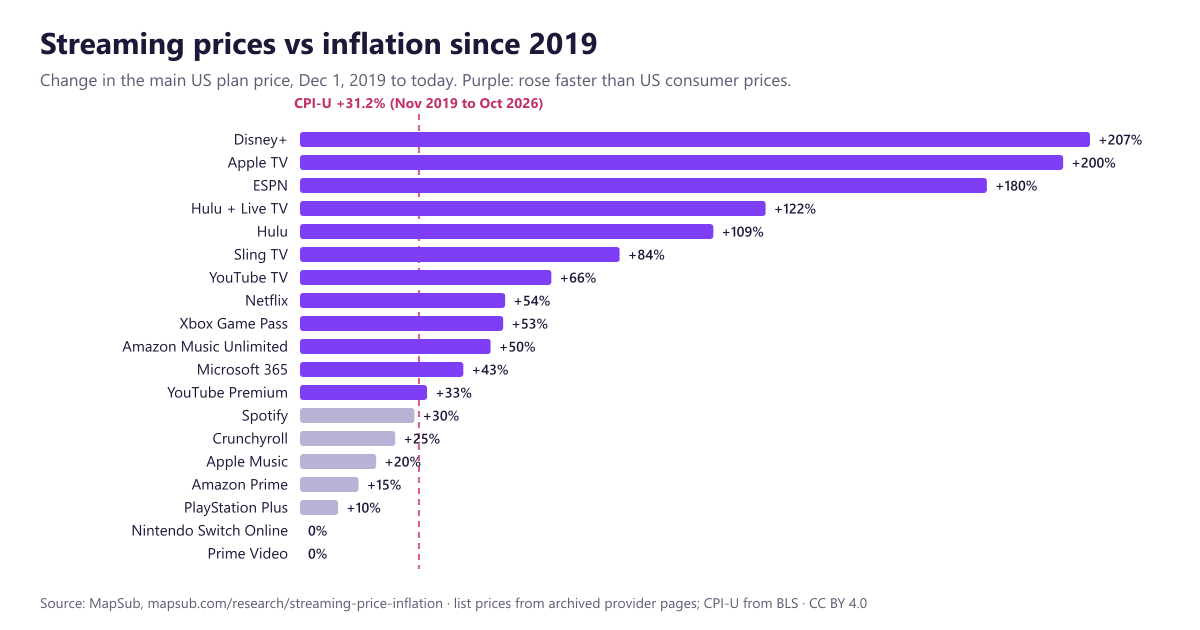
The main plans of 12 of 19 US streaming and digital subscriptions rose faster than inflation between Dec 1, 2019 and today. The median plan rose 50.1%; US consumer prices rose 31.2% (CPI-U, Nov 2019 to Oct 2026). Disney+ and Apple TV roughly tripled.
Key findings
- Median rise 50.1%, average 68.6%, against 31.2% for all US consumer prices.
- Biggest rises: Disney+ +207.4% (6.6 times inflation), Apple TV +200.4% (6.4 times inflation) and ESPN +180.4% (5.8 times inflation).
- Live TV: Hulu + Live TV $44.99 → $99.99, Sling TV $25 → $45.99 and YouTube TV $49.99 → $82.99.
- Unchanged: Nintendo Switch Online and Prime Video.
| Service | Plan | Dec 1, 2019 | Today | Change | vs inflation (31.2%) |
|---|---|---|---|---|---|
| Disney+ | Premium (No Ads) | $6.99/mo | $21.49/mo | +207.4% | 6.6× |
| Apple TV | Apple TV | $4.99/mo | $14.99/mo | +200.4% | 6.4× |
| ESPN | ESPN Select | $4.99/mo | $13.99/mo | +180.4% | 5.8× |
| Hulu + Live TV | Hulu + Live TV | $44.99/mo | $99.99/mo | +122.2% | 3.9× |
| Hulu | With Ads | $5.99/mo | $12.49/mo | +108.5% | 3.5× |
| Sling TV | Sling Orange | $25/mo | $45.99/mo | +84.0% | 2.7× |
| YouTube TV | Base plan | $49.99/mo | $82.99/mo | +66.0% | 2.1× |
| Netflix | Standard | $12.99/mo | $19.99/mo | +53.9% | 1.7× |
| Xbox Game Pass | Ultimate | $14.99/mo | $22.99/mo | +53.4% | 1.7× |
| Amazon Music Unlimited | Prime member | $7.99/mo | $11.99/mo | +50.1% | 1.6× |
| Microsoft 365 | Personal | $6.99/mo | $9.99/mo | +42.9% | 1.4× |
| YouTube Premium | Individual | $11.99/mo | $15.99/mo | +33.4% | 1.1× |
| Spotify | Individual | $9.99/mo | $12.99/mo | +30.0% | slower |
| Crunchyroll | Fan | $7.99/mo | $9.99/mo | +25.0% | slower |
| Apple Music | Individual | $9.99/mo | $11.99/mo | +20.0% | slower |
| Amazon Prime | Prime | $12.99/mo | $14.99/mo | +15.4% | slower |
| PlayStation Plus | Essential | $9.99/mo | $10.99/mo | +10.0% | slower |
| Nintendo Switch Online | Individual, 12 months | $19.99/yr | $19.99/yr | 0.0% | no change |
| Prime Video | Prime Video | $8.99/mo | $8.99/mo | 0.0% | no change |
| US consumer prices (CPI-U, all items) | +31.2% | ||||
Download the table: CSV (CC BY 4.0). Cite as: MapSub, "Streaming prices vs inflation since 2019" (Nov 22, 2026), https://mapsub.com/research/streaming-price-inflation/, CC BY 4.0. Reporters: for other cuts of the data (a service, a plan, a different start date), email editorial@mapsub.com.
How we measured it
For each service we take its main US plan (the one most people mean by "the price") and read its price on Dec 1, 2019 and today from MapSub's price histories. Every price there was read on an archived copy of the provider's own page, which each history links. Dec 1, 2019 is the first date on which every service that existed in late 2019, Disney+ and Apple TV+ included, has a captured price.
Inflation is the US Bureau of Labor Statistics' Consumer Price Index for All Urban Consumers (CPI-U, all items, US city average, not seasonally adjusted, series CUUR0000SA0): 257.208 in Nov 2019 and 337.511 in Oct 2026, the latest month published when we retrieved it on Nov 22, 2026 (BLS data). BLS did not publish a value for October 2025.
Caveats: prices are list prices for new US subscribers, before tax, and exclude promotions and bundles. A plan can change what it includes at the same price (Prime Video added ads in 2024; Disney+ added a cheaper ad-supported tier in 2022, so the ad-free plan shown is not the cheapest way in). Left out because they launched after Dec 1, 2019 or no capture covers that date for their current main plan: Peacock (first captured 2020-02), Paramount+ (first captured 2021-04), HBO Max (first captured 2020-06), Apple One (first captured 2020-09), Fubo (first captured 2021-03), DIRECTV STREAM (first captured 2021-01) and NFL Sunday Ticket (first captured 2023-04).
More data
- Every dated increase, service by service: streaming price increases; all price histories in one file: all.csv (data dictionary and every download).
- What households spend: how much Americans spend on subscriptions.
- Today's cheapest options: cheapest streaming services, ranked.
MapSub isn't affiliated with any service listed. Service names are trademarks of their owners.
Questions and answers
Have streaming prices risen faster than inflation?
For most services, yes. Between Dec 1, 2019 and today, the main plan of 12 of the 19 US streaming and digital subscriptions we track rose by more than US consumer prices (CPI-U, up 31.2% from Nov 2019 to Oct 2026). The median rise was 50.1%.
Which streaming service has raised prices the most since 2019?
Disney+ (Premium (No Ads): $6.99 to $21.49, +207.4%), Apple TV (Apple TV: $4.99 to $14.99, +200.4%) and ESPN (ESPN Select: $4.99 to $13.99, +180.4%).
How much have streaming prices gone up since 2019?
The median main-plan price rose 50.1% and the average 68.6% across 19 services, against 31.2% for all US consumer prices over almost the same period.
Did any service not raise its price?
Nintendo Switch Online ($19.99/yr) and Prime Video ($8.99/mo) cost the same as in 2019. Prime Video now shows ads unless you pay for the ad-free add-on, so the same price buys less.
Can I use this data?
Yes, under CC BY 4.0 with a link to this page. The table is also a CSV file, and each service's full history is on its own page with the archived sources.