
Subscription price data
544 dated price periods for 37 subscription services, from 1998 to today, each linked to an archived copy of the provider's own page. Free to download and reuse under CC BY 4.0. Last updated Nov 22, 2026.
Files
- all.csv: every price period of every service below (544 rows, one file).
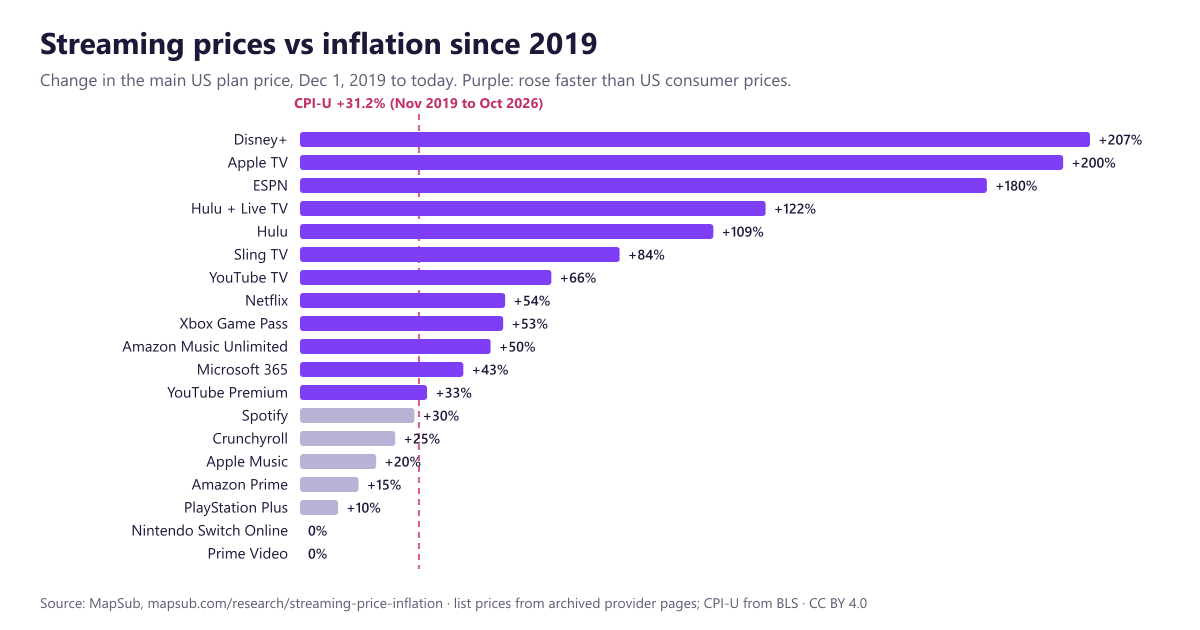
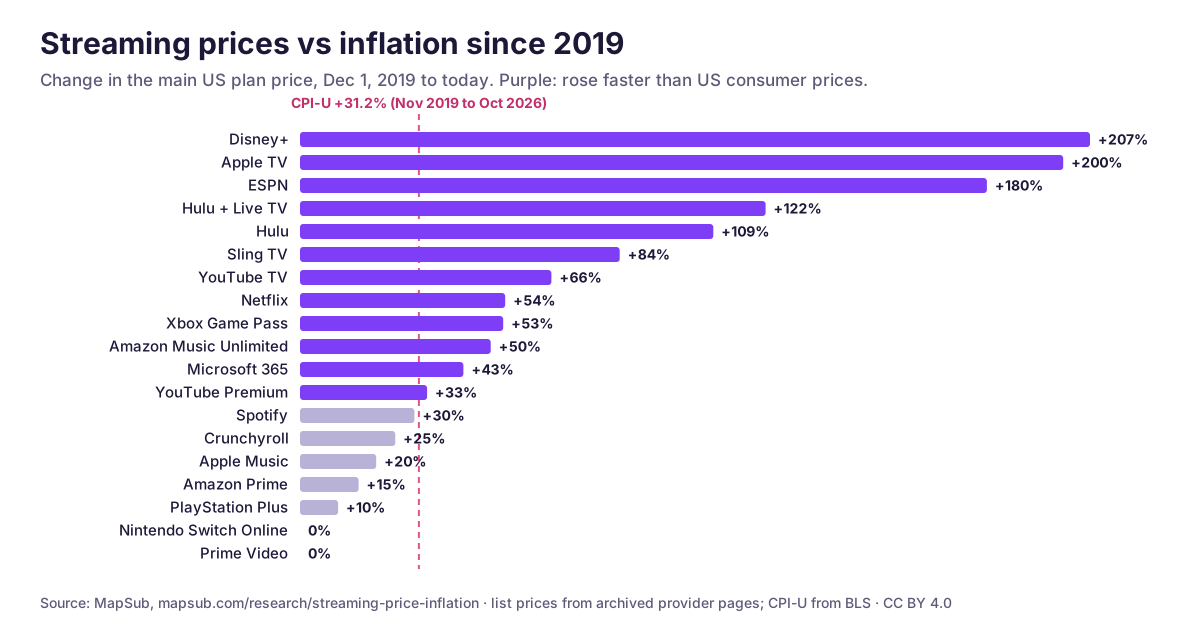
- streaming-inflation.csv: main US plan of 19 streaming and digital services on Dec 1, 2019 and today, against CPI-U (the study; chart as PNG or SVG).
- prices.json: current prices of the subscriptions and software MapSub tracks, each with the date it was checked on the provider's site (last checked Nov 1, 2026).
Data dictionary: price history files
One row is one price period: a plan at one price, between the first and last archived capture that show it. The per-service files and all.csv share these columns.
service- Service name as MapSub uses it (for example "Netflix", "YouTube TV").
plan- Plan name as the provider showed it at the time, plus ", annual", ", 12 months" etc. for longer billing terms.
plan_line- The plan's current name, so a renamed plan stays one series (for example Audible Gold and Platinum rows carry their Premium Plus line).
price- List price in the currency below, before tax.
currency- USD for US services; GBP for Netflix UK.
per- Billing period the price covers: month, quarter or year (a season for NFL Sunday Ticket).
first_seen- Date (YYYY-MM-DD) of the earliest archived capture that shows this price. The change happened on or before this date.
last_seen- Date of the latest capture that still shows this price. The next price was first seen after it.
still_current- true if this is the price today (re-checked monthly).
first_seen_is_earliest_capture- true if first_seen is simply the oldest usable capture, so the price may have started earlier.
evidence_url- The archived copy (usually Internet Archive) of the provider page the price was read on.
mapsub_page- all.csv only: the MapSub page that explains the history, with effective dates where the provider published them.
Data dictionary: streaming-inflation.csv
service, plan, unit- The service, the main US plan compared and its billing unit.
price_2019-12-01- The plan's list price on Dec 1, 2019.
price_now- Its list price today.
change_pct- Percent change between the two.
cpi_u_change_pct- Percent change in CPI-U (BLS, all items, not seasonally adjusted) from Nov 2019 to Oct 2026.
cpi_u_2019-11, cpi_u_<latest>- The two CPI-U index values used.
mapsub_page- The price history the two prices come from.
How the data is collected, and its limits
Prices are read on archived copies of each provider's own pricing, sign-up or help pages, and today's price on the live page. A price change happened between a row's last_seen and the next row's first_seen; where the provider announced an exact effective date, the service's MapSub page gives it with the source.
Limits: these are list prices for new subscribers before tax. Promotions, bundles, student and regional discounts, add-ons and app-store prices are left out unless the plan name says otherwise. Gaps between captures can hide a short-lived price. All services are US prices except Netflix UK. Method in full: editorial standards.
How to cite
MapSub, "US subscription price histories" (Nov 22, 2026), https://mapsub.com/data/, CC BY 4.0. For one service, cite and link its page instead. Questions or a cut of the data we don't publish: editorial@mapsub.com.
Questions and answers
Can I use MapSub price data in an article or a project?
Yes. All files on this page are licensed CC BY 4.0: you may copy, adapt and republish them, commercially too, if you credit MapSub and link to the page or file you used.
How often is the data updated?
Current prices are re-checked every month, and a new price is added when that check finds it on the provider's page. The inflation comparison is refreshed when the Bureau of Labor Statistics publishes a new CPI month.
Where do the prices come from?
From the providers' own pages: every row links to an archived copy (usually on the Internet Archive) that shows the price. MapSub does not use prices from press coverage or other trackers.